Validation of Clinical Dashboards for Decision Making

The PowerBI Dashboard has become the signature tool for clinical data analysis, and the growing dependence on PowerBI’s automated visualization tools has led to the need of dashboard validation. Clinical dashboards are built by ingesting raw data and transforming that data into models and visualizations. Validation is necessary to ensure that there is no oversight or misuse when the ingested data is transformed by a multitude of PowerBI’s capabilities.
Currently, the validation process is very manually intensive and difficult to regulate.
In fact, industry standards have not yet been established for how to appropriately validate a clinical dashboard. To ensure that the integrity of decision making based on clinical dashboards is upheld, current techniques and approaches for validation must be improved.
Why We Validate at MMS
Since there are no established industry standards for validation, much of the intensive process is left up to self-determination. As a result, MMS approaches validation through a linear three-step process. The first of which is data ingestion, followed by model integrity, and then visualization.
The following diagram demonstrates validation moving left to right. If the process uncovers issues with data tables, then there is no reason to continue to validate for model integrity, visualizations. Thus, the validation process should move linearly.

Data Ingestion
Data ingestion occurs when PowerBI loads in the data that is used to build the clinical dashboard. During this process, a user can alter the data by using the power query editor. The query editor has a variety of functions and can change a data table drastically.
However, it is necessary to validate against the abilities of the editor to ensure that there is no oversight during these large transformations. Accidental dropping of rows, improper merges, and misrepresentation of clinical data are all examples of possible mistakes he PowerBI query editor can make, and validation is required to catch these errors when they occur.
Model Integrity
When there are multiple tables within a PowerBI report, the connections established between these tables are called a model. The PowerBI model view allows for visualization of all the different properties and connections for the clinical dashboard.
Currently, MMS validates for model integrity through visual inspection. By checking that the relationships between tables are set up correctly and that cross filters are set per specification, one can limit improper behavior within a clinical dashboard’s model.
Visualizations
PowerBI visualizations are built to represent data in many ways. They are built by selecting columns of data, and representing them as different types of charts, tables, or graphs. After they are built, they can be temporarily transformed by different slicer and filter methods.
However, it’s necessary to ensure that these methods are accurately representing the clinical data they are affecting. Validation is required to ensure that these PowerBI transformation tools do not misrepresent the visualized data and lead to incorrect assumptions.
How We Validate
Understanding why validation for PowerBI dashboards are necessary is only half the battle. The methods for implementing validation capabilities are difficult, especially because of the lack of industry standards.
The principal purpose of validation is to ensure that data is not incorrectly represented or transformed by PowerBI operations and tools, and by understanding these operations and tools it’s possible to use rival programming as a technique to validate.
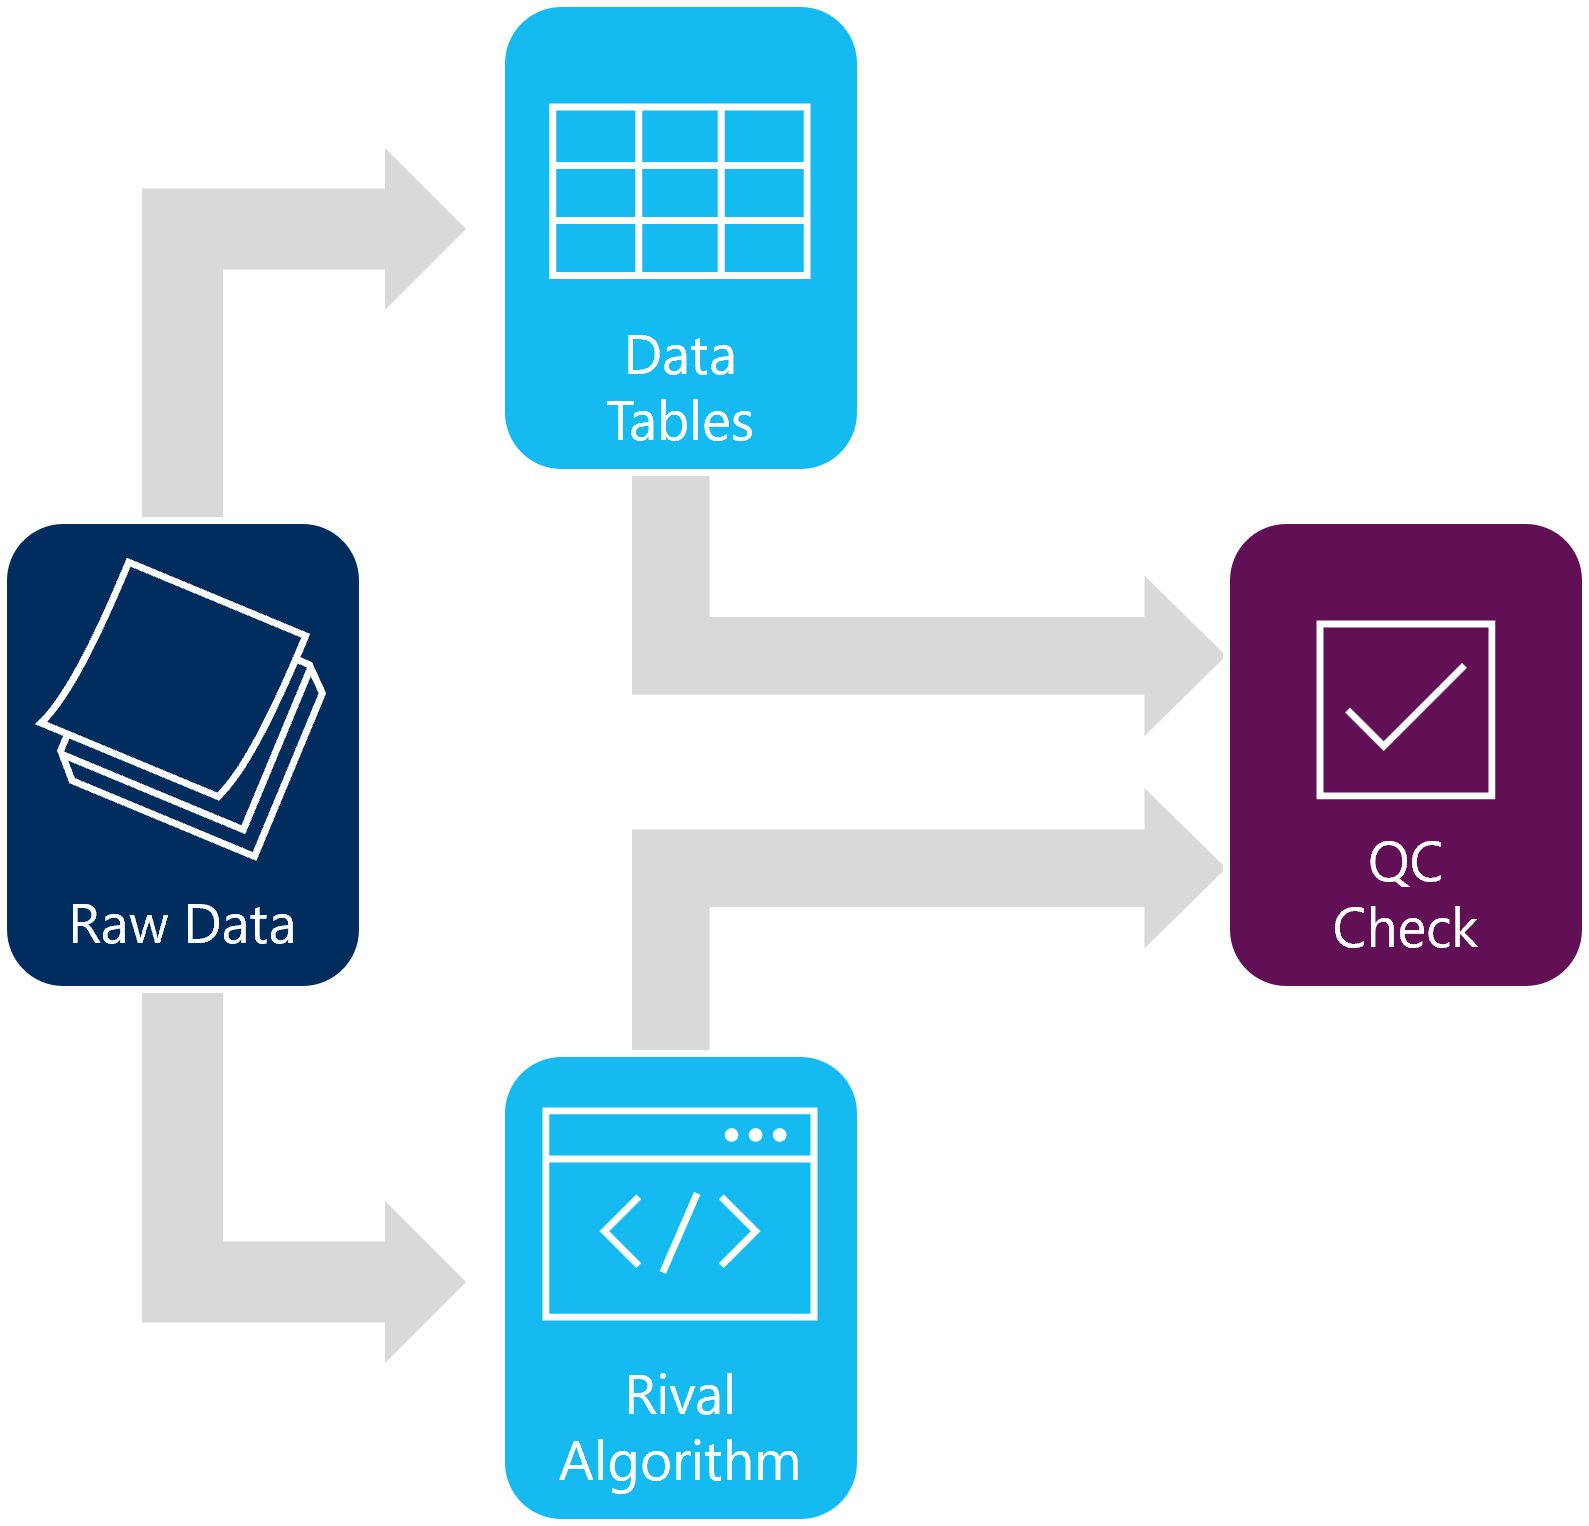
Rival programming involves writing programs that perform the identical tasks to PowerBI. Both PowerBI and the rival program perform operations on the same data and compare the results using a quality control check. Each type of validation has a different approach to rival programming.
Data Ingestion
Rival Programming is implemented when validating for data ingestion by using the raw data from the model. That raw data will be transformed and filtered in the same way that the PowerBI query editor did.
This task is accomplished using a rival algorithm that can perform the same transformations as PowerBI using simple coding techniques. Both the PowerBI transformed data and the rival algorithm data are then compared in a quality control check. Any discrepancies between them would suggest that there is oversight in PowerBI’s transformation.

Model Integrity
Validation of a dashboard’s model integrity does not require any form of testing or rival programming. Instead, a visual inspection is performed. There is an individual inspection on each relationship, the purpose of which is to check that the proper columns are linked together.
Furthermore, there may be red flags, such as the “many-to-many” cardinality, that cause persistent issues within the clinical dashboard. If these red flags pop up, it is best practice to check with the designer of the clinical dashboard that they are the intentional.
Visualizations
The last stage of validation is undoubtedly the largest and most time-consuming. A standard PowerBI visualization has so many ways that it can be filtered, and to test against ever different state of the visual would be unreasonable.
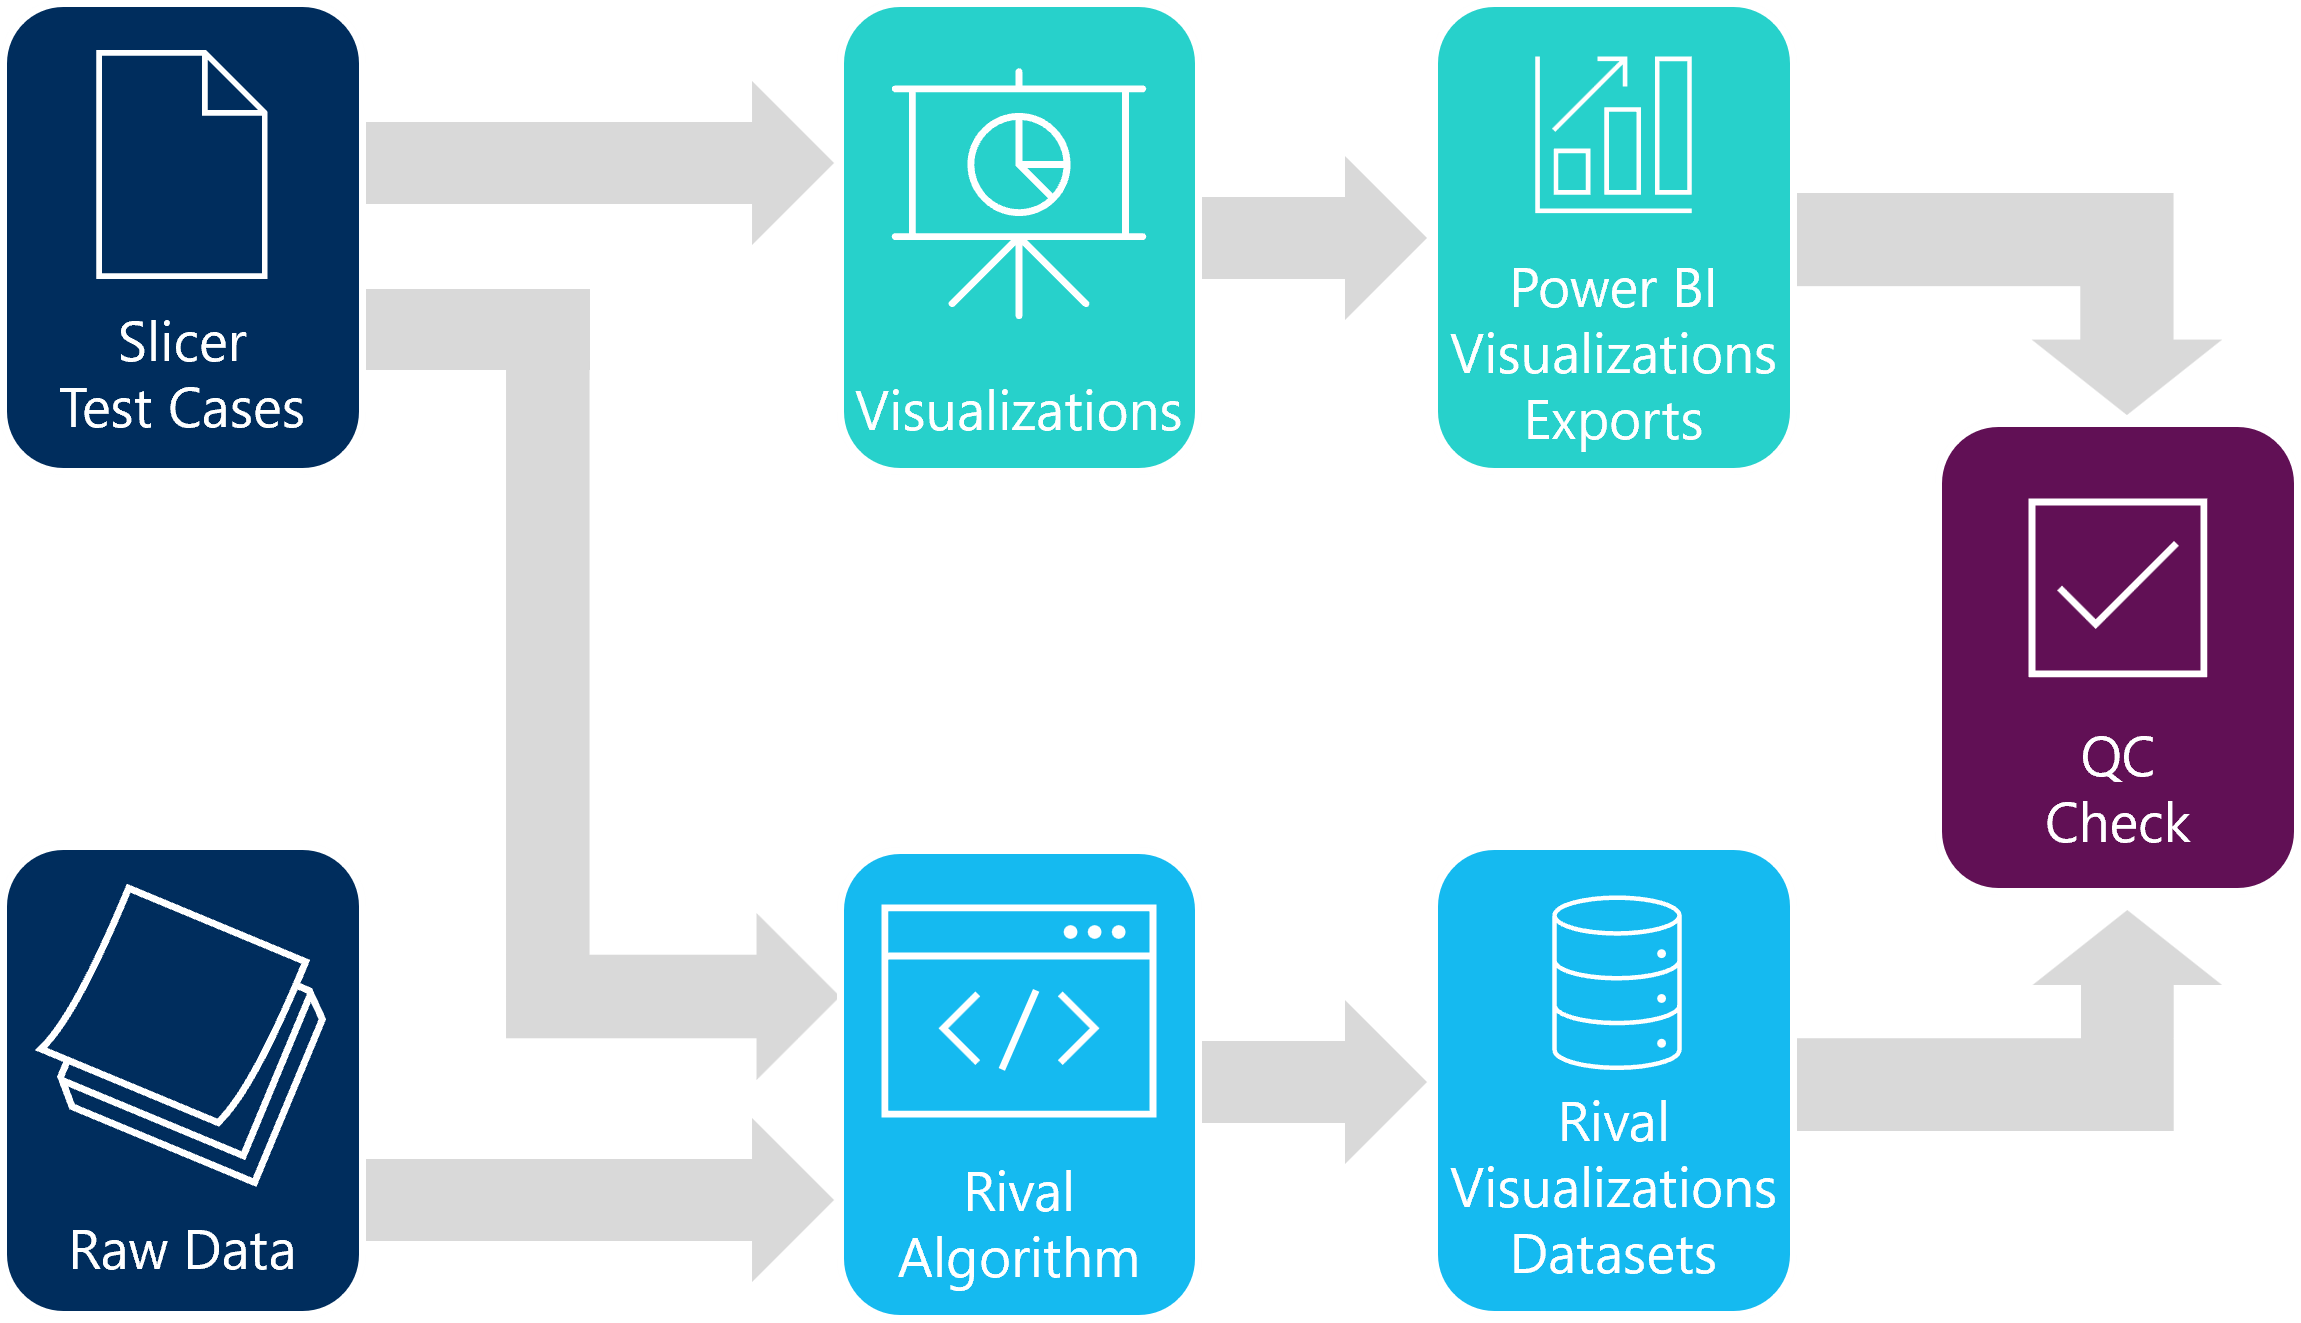
Thus, visualizations are validated using a configuration file. The config file contains a small sample of different ways to filter visuals, otherwise known as slicer test cases. Each individual test case would have several slicer states to filter the visual. The size of the config file and number of test cases varies based on the size of the dashboard.
A rival algorithm the uses the configuration file to filter the raw data identically to PowerBI. The filtered underlying data from PowerBI and the rival algorithm are compared in a quality control check to ensure that there are no discrepancies.

Validation is the best way to ensure that clinical dashboard standards are upheld. By employing the three steps discussed above, one can limit oversight and misrepresentation within clinical dashboards. Therefore, by ensuring that data is used ethically, the industry can benefit from the analysis that clinical data can provide.
For questions on this and other Data science services, please click here and we will connect you with the appropriate expert.
Authored by: River Meckstroth, Data Science


